Hampshire County Socio-Economic Report

Co-authors: Emily Hodos, Juan Rojas Lopez & Swetha Hiranya Venuturupalli
RP 620 Quantitative Methods | Prof. Henry Renski
November 4, 2002
INTRODUCTION
Hampshire County is one of three counties that make up the Pioneer Valley and is situated along the east and west sides of the Connecticut River. It is often referred to as the “Five College Area” because it is home to the University of Massachusetts Amherst, Amherst College, Hampshire College, Mount Holyoke College, and Smith College.
As one travels throughout the county, they will discover both rural areas with farm land, such as Huntington and Westhampton, and more urban and densely populated areas like the centers of Northampton, Amherst, and the Route 9 corridor in Hadley. Hampshire County is also home to one of the region’s major hospitals, Cooley Dickinson (Mass General Brigham), with a significant array of additional physical and mental health services.
This report has been designed to identify historic patterns and the current status of Hampshire County employment and its citizens to help pave a path for new, long-term economic strategies.
WHAT’S BEEN HAPPENING IN HAMPSHIRE COUNTY? A Brief Overview
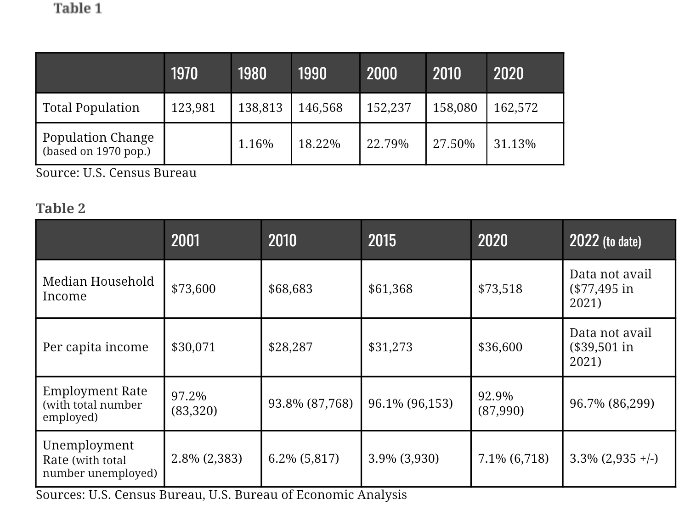
From 1970 to 2020, Hampshire County experienced significant population growth. This may be due to variables such as migration to the county from more urban regions and growth of employment industries such as health care and higher education (see Table 1).
Relative to the economy, both median household income and per capita income have increased modestly from 2001 to 2021. The employment rates, on the other hand, have shown much more variability. There was a significant increase in unemployment in 2010 and 2020 which relate directly to the fall out of the 2008 recession and the impact of COVID-19 in 2020 (see Table 2).
A CLOSER LOOK AT THE HAMPSHIRE COUNTY ECONOMY
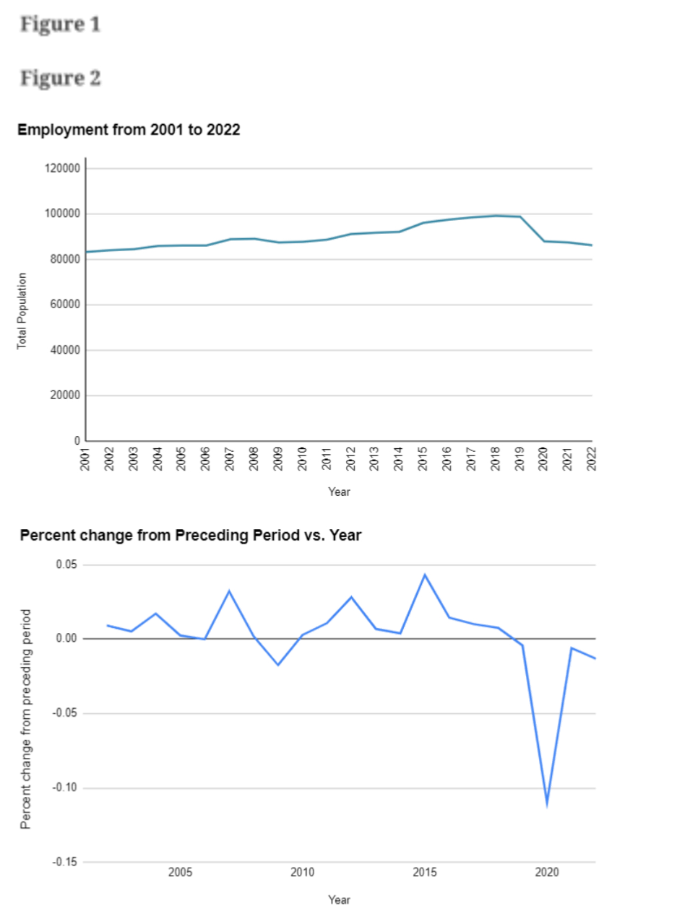
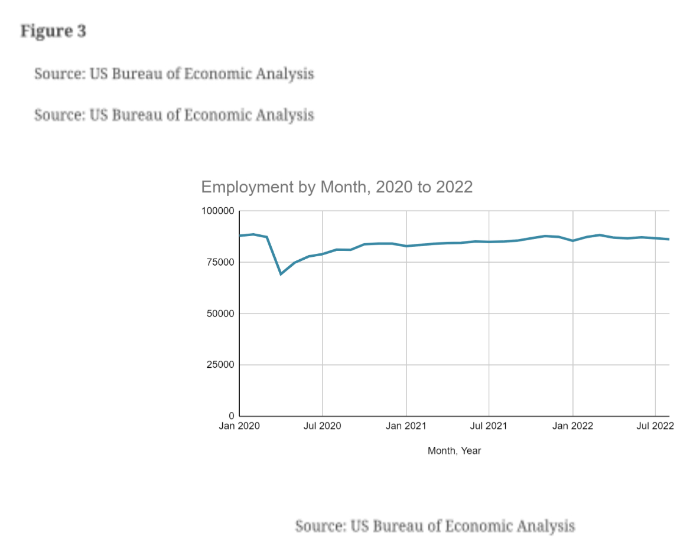
Employment in Hampshire County, overall, shows modest shifts between 2001 and 2019. In 2001, there were a total of 83,320. By 2019, the number increased to 98,846 for a percentage change of almost 19%. This number fell 11% to 87,990 in 2020, which was due to the start of the COVID-19 pandemic (see Figures 1 & 2). Looking at the impact and start to its economic recovery, the lowest employment was in April 2020 with 69,335 jobs. As of August 2022, the number has increased to 86,299 (see Figures 3).
Employment by Industry
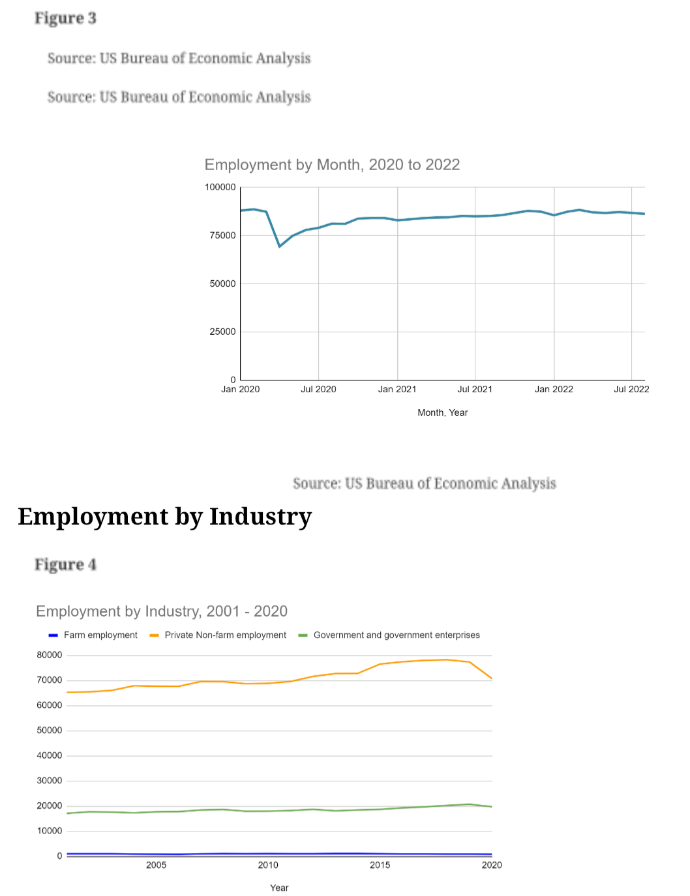
Agriculture and Farming are two primary industries in Hampshire County and Western Massachusetts as a whole. In 2017, Hampshire County held 9.56% of the total number of farms in the state generating sales of over 46 Million dollars. Source: Agricultural Resources Facts and Statistics | Mass.gov.
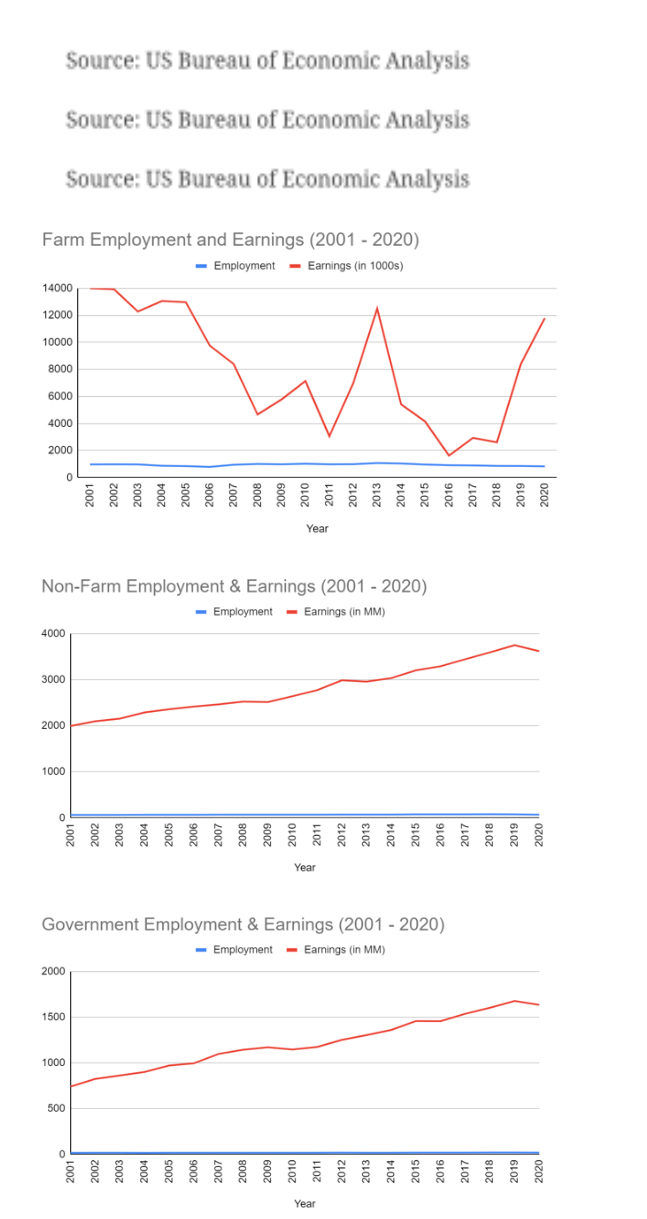
Since 2001, the number of people employed by these farms has remained stable, making it the county's primary industry. However, the industry's earnings have not followed the same pattern and have fluctuated, with 2016 seeing the lowest level (see Figure 4).
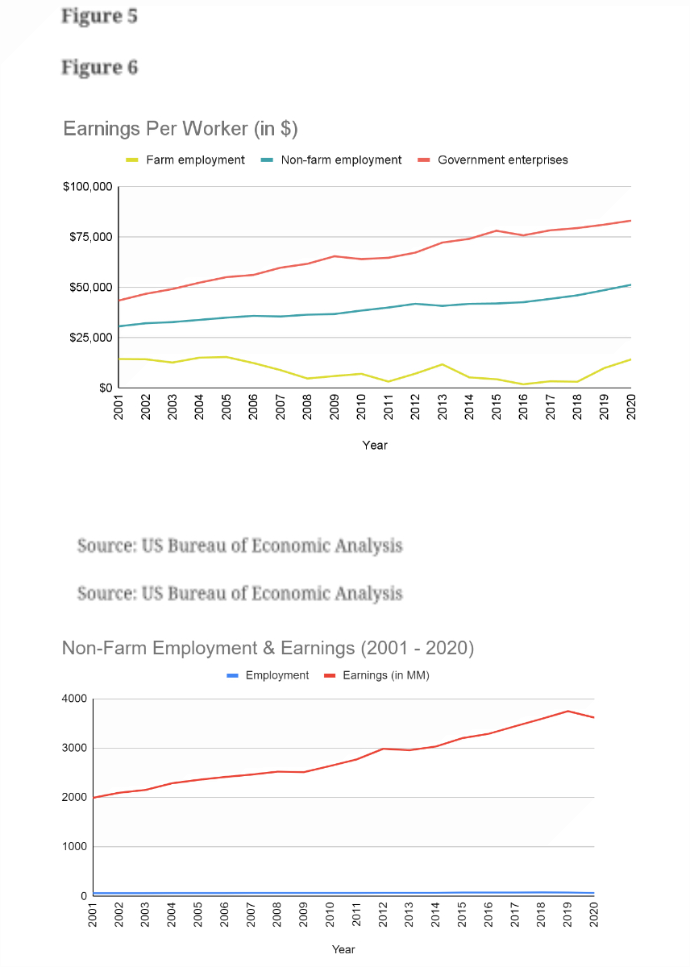
Between 2001 and 2019, non-farm earnings, which include the private sector, surged significantly, nearly doubling. Although there was a slight dip in 2020, the trend has since stabilized. Between 2001 and 2020, this industry's employment increased on average by 2.7%. The government and government-owned enterprises did the same (see Figures 5 and 6).
In Hampshire County, government employees are paid more than any other group of workers. They consist of both state and local government personnel as well as federal civilian employees. Despite a significant wage differential between the two sectors, workers in healthcare and social assistance receive less money per employment than other occupations. Despite their lesser number, farm employees see greater year-over-year pay variations.
Healthcare and Social Assistance surpassed Educational Services in terms of job growth in 2011. The pattern persisted through 2020.The accommodation and food services business similarly declined in 2020, with numbers plummeting 33% from 6815 to 4587.
Other Services, defined as establishments engaged in providing services not specifically provided for elsewhere in the classification system, surpassed accommodation, and food services as Hampshire County's fifth largest employer in 2020, owing largely to the world working remotely and shifting working locations to home.
Other services included establishments, primarily engaged in activities, such as equipment and machinery repairing, promoting, or administering religious activities, grantmaking, advocacy, and providing dry cleaning and laundry services, personal care services, death care services, pet care services, photofinishing services, temporary parking services, and dating services. Despite being an industry undergoing substantial digital disruption, Retail Trade has been a consistent job creator from 2001 to 2019.
In 2020, we saw a surge in growth, which could be attributed to more retailers offering their services online in addition to in-store.
Professional, Scientific, and Technical Services jobs fell from 2016 to 2019, with positive growth in 2020, reversing the previous five-year trend.
Some data, denoted by the broken lines, corresponding to specific years and industries, is not available to avoid disclosure of confidential information; estimates are included in higher-level totals.
In Hampshire County, government employees are paid more than any other group of workers. They consist of both state and local government personnel as well as federal civilian employees. Despite a significant wage differential between the two sectors, workers in healthcare and social assistance receive less money per employment than other occupations. Despite their lesser number, farm employees see greater year-over-year pay variations.
HOW DOES HAMPSHIRE COUNTY STACK UP?
To gain a clear measure of the population and economic health and status of Hampshire County, the following are comparisons of the county to both Massachusetts and the United States.
Population
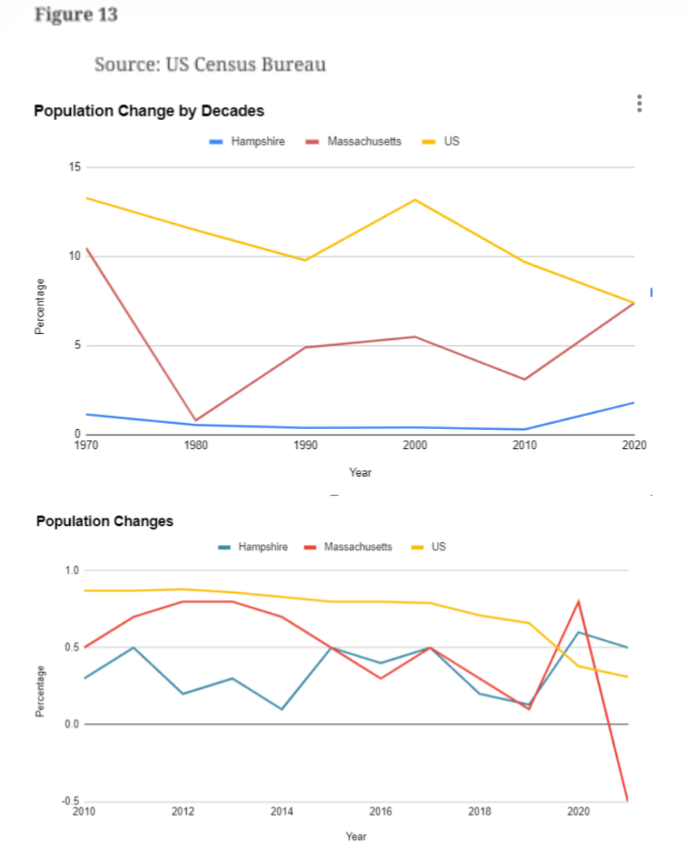
There are many ways of looking at population. In terms of the general changes in total population, both Massachusetts and the United States show more variability than Hampshire County from 1970 to 2020 (see Figure 12). If one takes a closer look at the last decade, the rates become more variable for Hampshire County but, overall, not as high or variable as Massachusetts or the United States (see Figure 13).
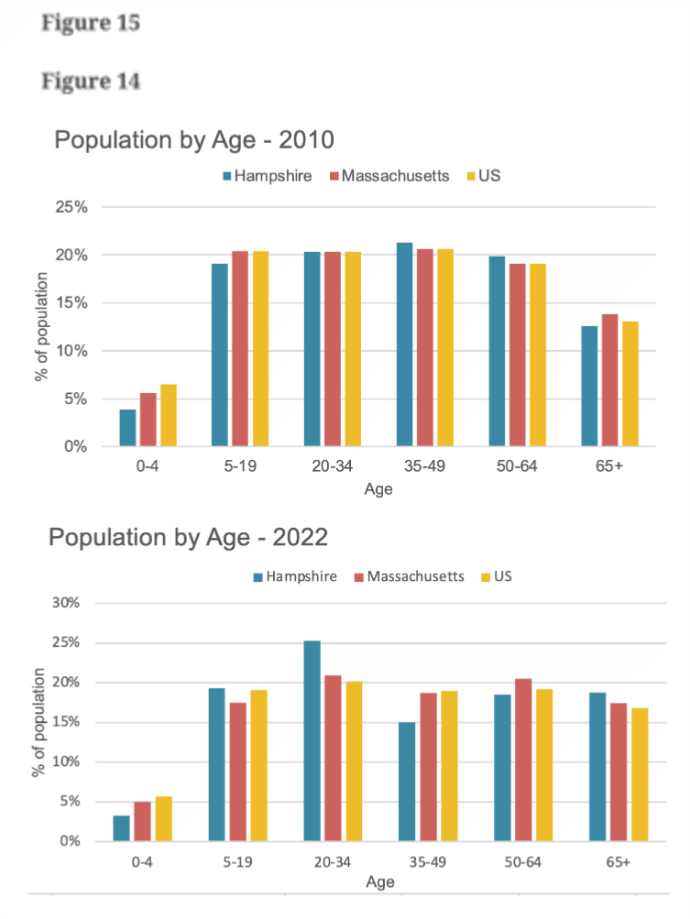
Looking at the distribution of population by age in 2010, there was a generally similar pattern for Hampshire County, Massachusetts, and the US with the 0-4 age being lower and the 35-49 age higher for Hampshire County (see Figure 14). Then, by 2022, distributions shift drastically, with Hampshire County showing a more significant increase, especially those 5-19 and 20-34 (see Figure 15). Coupled with a view of the net migration, it is clear that many young adults migrated into Hampshire County between 2010 and 2022 (see Figure 16).
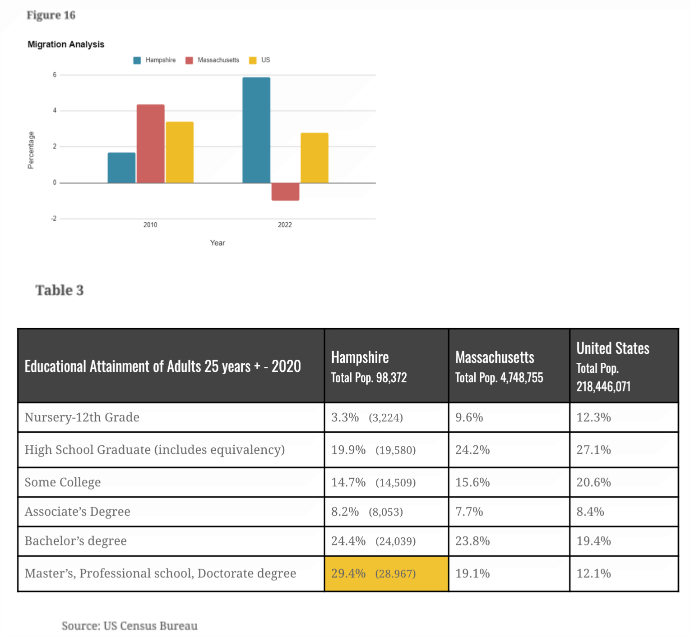
The most remarkable population measure between Hampshire County and both
Massachusetts and the US is related to educational attainment. Because of the “5 college area” influence as an employer, student base, and general community culture, not surprisingly, Hampshire County has a significantly higher population of those with graduate and professional degrees than both Massachusetts and the US
Employment and Economy
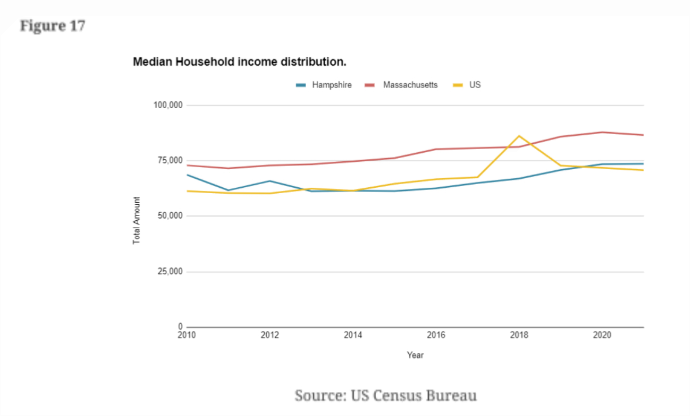
Looking at the comparison of median household income across the county, state and nation for 2010-2021, Massachusetts has a consistently higher income level than either Hampshire County or the US. By 2021, Massachusetts household income is over $80,000, whereas Hampshire County and the US are both slightly under $75,000 (see Figure 17). This is approximately a 13% difference.
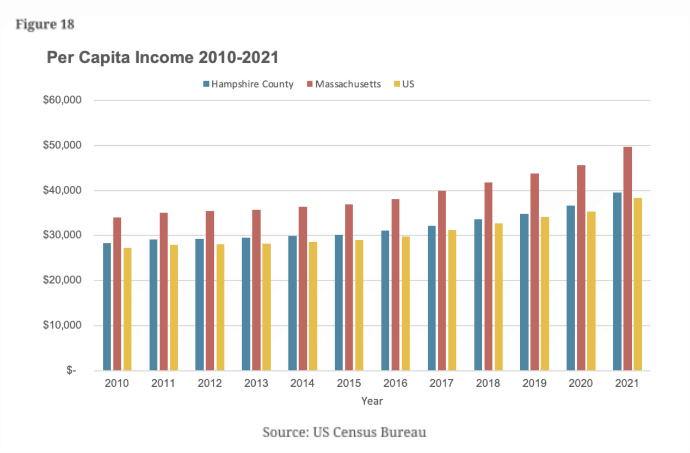
In parallel but with an even more dramatic disparity, Massachusetts has grown to be far ahead of Hampshire County and the US in per capita income. By 2021, Massachusetts per capita income is almost $50,000 whereas Hampshire County and the US are both slightly under $40,000 (Figure 18). This is nearly a 20% difference.
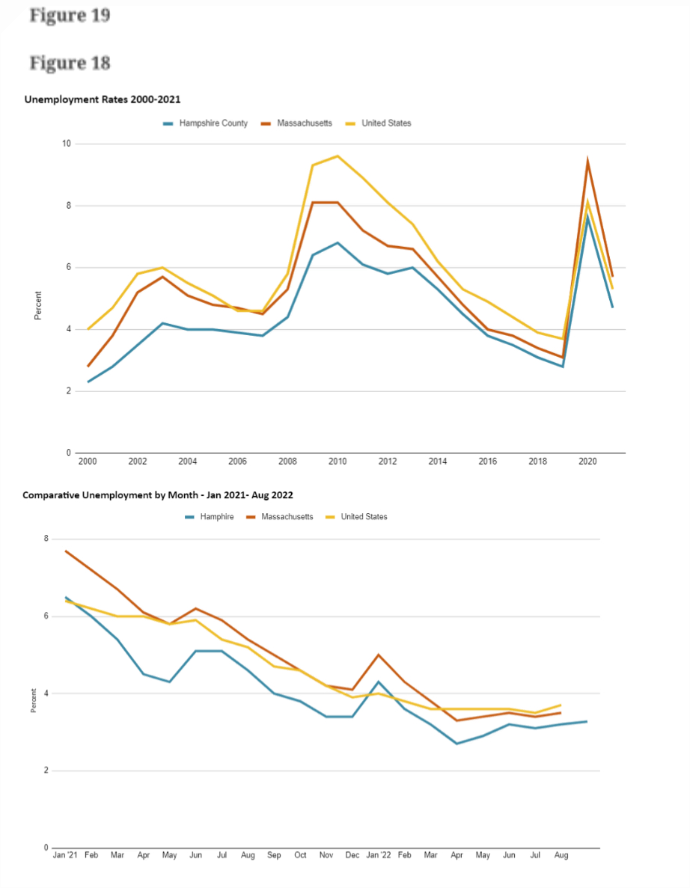
While income levels may waver over the past 20 years, Hampshire County has had an unemployment rate consistently lower than both the average annual rate for Massachusetts or the country. In addition, there are two other factors that suggest greater stability for the employment market in Hampshire County over both Massachusetts and the nation. First, the difference between its lowest and highest rates over this time period is lower for Hampshire County - with a range of 5.3% (the high was 7.6% in 2020 and the low was 2.3% in 2000). In contrast, Massachusetts had a difference of 6.6% and the United States was 5.7% (see Figures 19 and 20)
WHAT ARE THE KEY TAKE-AWAYS?
- Because of the recent changes in population by age, Hampshire County may benefit from focusing more efforts on attracting those who are in the 20-34 and 35-49 age groups. This potential growth could, in turn, positively impact growth of the youngest population level (0-4) as well as per capita and household income.
- Considering the high educational attainment levels for residents of Hampshire County, it may be surprising that both per capita and household income would not rise above the national level in a more measurable way.
- The two time periods of most stress on the economy - 2010 as a fall-out of the 2008 recession, and 2020, as a result of COVID-19 - Hampshire County shows its ability to withstand the challenges and stress, especially during the 2008 recession, than both the Commonwealth and the US. This suggests a couple things looking towards the future of the area. The first is that Hampshire County is situated in a way that can more greatly handle the ups and downs of the economy. In addition, this is likely the result of a stronger balance of employment across industries to sustain a stronger economy in times of recession or other significant economic stress.
SOURCES
U.S Census Bureau, Population by County, State, United States, Table number: B15002, Median income by county
https://www.census.gov/data/datasets/time-series/demo/popest/2010s-counties-total.html
https://www.census.gov/quickfacts/fact/table/hampshirecountymassachusetts/RHI225221
U.S. Census Bureau, Per Capita Income by County, State, United States, Table number: B19301. Extracted Nov 3, 2022.
U.S. Census Bureau, Median Income by County, State, United States, Table number: S1501.
U.S. Census Bureau, Median Income by County, State, United States, Table number: S1903. Extracted Nov 3, 2022.
U.S. Bureau of Economic Analysis, CAINC4 Personal income and employment by major component data set, Oct 29, 2022
U.S. Bureau of Economic Analysis, CAINC5N Personal income by major component and earnings by NAICS industry 1/ Oct 29, 2022
https://beta.bls.gov/dataViewer/view/timeseries/LAUCN250150000000005
Series Title: Employment: Hampshire County, MA (U)
Series ID: LAUCN250150000000005
Extracted on Oct 29, 2022
U.S. Bureau of Labor Statistics, Local Area Unemployment Statistics, Massachusetts/Statewide, 2000-2022, Series: LAUST250000000000003, LAUST250000000000004, LAUST250000000000005, LAUST250000000000006, LAUST250000000000007, LAUST250000000000008, LAUST250000000000009. Extracted Oct 27, 2022
U.S. Bureau of Labor Statistics, Local Area Unemployment Statistics, Hampshire County/Counties and equivalents, 2000-2022, Series: LAUCN250150000000003, LAUCN250150000000004, LAUCN250150000000005, LAUCN250150000000006. Extracted Oct 27, 2022
U.S. Bureau of Labor Statistics, Unemployment Rate, United States, 2000-2022, Series: LNS14000000. Extracted Oct 27, 2022